Roma vs Real Madrid finished 3–4 at Stadio Olimpico on 14 October 2026, with Madrid overturning a 3–1 deficit in the UEFA Champions League league phase. Carlos Espí, Endrick and Antonio Rüdiger scored at 83, 85 and 90 minutes respectively. All three late goals came from corner sequences, according to the AFP/AP report published by Al Jazeera. That makes this more than a story about possession: it is a useful example of how set-piece footage, chance-quality data and an offside review can explain a dramatic result.
If you watched the score change and wondered how Roma lost control, start with the incidents rather than a dashboard full of numbers. Roma had more possession, but Madrid generated more shots, more corners and the higher published expected-goals total. The decisive details concern where chances developed and what happened after the first contact at corners—not an unverified claim that an AI system told a coach how to win.
This article combines ESPN’s match statistics with the AFP/AP match report and UEFA’s published technology guidance, checked on 15 October 2026. The result and numbers are match-specific. The sections on coaching software, GPS tracking and AI explain how analysis can be performed; the clubs’ private tracking feeds and internal software are not available here. For the underlying workflow, our AI video analysis in sports guide explains why footage and human verification still matter.
Key takeaways
- Roma’s 54% possession did not prevent a 3–4 defeat: Madrid led the published shot count 16–14 and corner count 9–5.
- ESPN displayed 1.43 xG for Roma and 1.83 for Madrid. These are provider model estimates, not an alternative score or a guarantee about who should win.
- The reported VAR review of Donyell Malen’s second goal is a confirmed match incident. Private GPS totals, a named team AI system and goal-line alerts were not verified.
- Video review should distinguish the initial corner delivery, first contact and rebound. Combining these into one highlight can hide the defensive question.
Roma vs Real Madrid Match Overview
The match is completed, not an upcoming fixture or a live-score service. Roma hosted Real Madrid in Rome on 14 October; the teams were level at 1–1 at half-time before Roma moved ahead through two Malen goals. Madrid’s final three goals changed a two-goal deficit into an away win.
| Detail | Verified information |
|---|---|
| Competition | UEFA Champions League 2026/27, league phase |
| Venue | Stadio Olimpico, Rome, Italy |
| Match date | 14 October 2026 |
| Status | Completed / full-time |
| Half-time score | Roma 1–1 Real Madrid |
| Final score | Roma 3–4 Real Madrid |
| Roma manager | Gian Piero Gasperini |
| Real Madrid manager | José Mourinho |
The overview follows the inspected ESPN match page and the AFP/AP report. Dates here identify the fixture, not a claim that the game is happening today. This article does not continuously refresh scores or provide a viewing service.
Starting XI and formations
ESPN listed Roma in a 3–4–2–1 and Real Madrid in a 4–2–3–1. The table records the starting players, not a claim that either team held a fixed shape throughout every phase. Substitutions, possession and defensive responsibilities can change the positions seen on video.
| Team | Goalkeeper | Defenders | Midfield and attacking support | Forward |
|---|---|---|---|---|
| Roma — 3–4–2–1 | Pierluigi Gollini | Gianluca Mancini, Evan Ndicka, Mario Hermoso | Wesley, Marten de Roon, Manu Koné, Nahuel Molina; Matías Soulé and Paulo Dybala | Donyell Malen |
| Real Madrid — 4–2–3–1 | Thibaut Courtois | Denzel Dumfries, Antonio Rüdiger, Ibrahima Konaté, Marc Cucurella | Federico Valverde and Aurélien Tchouaméni; Yan Diomande, Jude Bellingham and Vinícius Júnior | Kylian Mbappé |
Roma replaced Koné with Niccolò Pisilli at 17 minutes and introduced Rodrigo Mora for Dybala at half-time in ESPN’s listed substitutions. The AFP/AP report describes Mora supplying Malen for the first of his second-half goals. That is a concrete substitution-to-incident connection; it does not prove that one change explains every subsequent attack.
The goal sequence that changed the game
Roma first led through de Roon, and Mbappé equalised before the interval. Malen then scored twice within six minutes after half-time. Madrid’s response arrived much later, when three corner sequences produced three goals.
| Minute | Scorer | Team | Score after the goal |
|---|---|---|---|
| 20 | Marten de Roon | Roma | Roma 1–0 Real Madrid |
| 25 | Kylian Mbappé | Real Madrid | Roma 1–1 Real Madrid |
| 51 | Donyell Malen | Roma | Roma 2–1 Real Madrid |
| 57 | Donyell Malen | Roma | Roma 3–1 Real Madrid |
| 83 | Carlos Espí | Real Madrid | Roma 3–2 Real Madrid |
| 85 | Endrick | Real Madrid | Roma 3–3 Real Madrid |
| 90 | Antonio Rüdiger | Real Madrid | Roma 3–4 Real Madrid |
Roma vs Real Madrid Tactical Analysis
The clearest tactical evidence is the contrast between Roma’s successful second-half attacking moments and Madrid’s late set-piece production. A formation label is the starting point, but a useful review asks what happened in each possession: who received the ball, where a runner moved and whether the defence dealt with the second phase.
Roma’s playing style and tactical approach
Gasperini’s team started strongly in the AFP/AP account and took the lead through de Roon. The report also describes Malen exploiting a through ball for his second goal after initially being flagged offside. Those incidents support a discussion of progressive passing and movement behind a defence. They do not establish a measured pressing rate, a specific pressing trigger or the height of Roma’s line over the whole match.
Roma’s 54% possession and 546 passes show a larger share of the published ball-possession and passing totals than Madrid’s. They do not, by themselves, reveal whether those passes broke lines or moved between unpressured defenders. To assess pressing resistance, an analyst would separate controlled build-up, contested receptions and clearances, then return to the footage around each turnover.
The late goals present a different problem from the earlier open-play successes. Reviewing corner defending should include the delivery, first contact, loose-ball response and the next attacker’s movement. A defender can win an initial contest while the team still concedes a rebound. It is more useful to examine that chain than to say the whole defence simply “switched off.”
Real Madrid’s tactical approach
Madrid finished with less possession but more published shots and corners. That is consistent with creating opportunities without dominating the possession percentage. It does not establish that every period of the game followed a planned counterattacking strategy: game state, substitutions and the need to chase a deficit also influence how a team attacks.
The AFP/AP report describes Espí finishing a close-range rebound, Endrick scoring a header and Rüdiger completing the turnaround with a close-range finish, each arising from a corner sequence. These are different finishing actions within a repeated set-piece route. The shared pattern is the route into the opportunity, not an identical shot or a single template repeated without variation.
An analyst reviewing Madrid’s build-up would also ask how the team arrived at those corners. The final score cannot answer that alone. Full footage and an event sequence are needed to connect wide attacks, blocked deliveries, territorial pressure and subsequent restarts. Our football video analysis software comparison explains the tagging features that help keep these sequences organised.
Key tactical battles
The midfield contest needs more context than the possession split. ESPN recorded 47 duels won by Madrid and 34 by Roma, but this is a team-wide total covering the provider’s duel definitions. It cannot be treated as a count of midfield battles or proof that one named midfielder dominated another.
Wide-area analysis should look at the ball carrier and the available support, then follow the next action. A pass to a wide player might lead to a cross, a recovery or a return pass. Madrid’s nine corners provide a reason to investigate wide attacking sequences, but they are not a complete map of where every attack originated.
The most important defensive-space question comes after a restart: who tracked the runner, who attacked the ball, and who covered a possible rebound? Those roles are visible only if the camera view retains enough of the penalty area. Tight goal replays can explain the finishing touch while leaving the preceding defensive organisation out of frame.
How Sports Technology Is Used in Roma vs Real Madrid Analysis
Sports technology helps organise evidence, measure defined events and revisit uncertain moments. It does not turn missing data into known facts. For this game, there are published event statistics and a reported VAR intervention. Public access to the teams’ private workload dashboards, positional feeds and coaching software was not established.
Video analysis and tactical cameras
A practical review begins by tagging the goals and the possessions around them. For a corner, the clip should start before delivery and continue through the rebound or clearance. Analysts can then compare the same phase across different corners rather than comparing unrelated close-ups of the scorer.
A wide tactical camera can retain more off-ball context than a television close-up. That distinction matters when assessing marking, support runs and the players positioned for a second ball. No dedicated club tactical-camera feed was reviewed for this article, so the defensive questions here are a review framework supported by the reported events—not a claim to have audited all 90 minutes from a tactical angle.
GPS tracking and player performance data
GPS vests and other athlete-monitoring systems can estimate movement and workload, subject to the device, venue and metric definitions. In football analysis, distance covered, sprint counts and high-intensity efforts require actual tracking records and disclosed thresholds. They cannot be calculated reliably from goals, possession or a player’s visible reaction after conceding.
No verified match-specific GPS dataset was available for this article. There is therefore no invented team distance, fastest sprint, fatigue score or individual workload figure. Late concessions are not proof of a measured fatigue problem. Our GPS tracking in sports guide explains what a tracker measures and why comparable thresholds are necessary.
AI-powered match analysis
AI football analytics can help suggest events, group similar passages and find footage for a human to check. An analyst might ask a system to collect corner sequences or possible through-ball attacks, then verify the selected clips and correct false labels. This can reduce searching time without removing the need to understand the game.
For Roma and Madrid, a useful question would be whether a repeated positioning problem appeared across the late corner sequences. It would not be responsible to claim that a named AI platform identified that problem during the match or instructed Mourinho to change tactics. No internal tool, coach communication or causal account of that kind was verified.
Computer vision and player tracking
Computer vision can detect people and balls in video, associate detections across frames and map locations onto a calibrated pitch. With suitable validated data, analysts can study team spacing and off-ball runs. Occlusion, camera movement and mistaken player identities can still produce errors, particularly in a crowded penalty area.
Those limitations are directly relevant to corner analysis. An attacker disappearing behind a group of players should not be treated as having stopped moving, and a tracking identity must not jump to a different player. Our computer vision in sports guide explains the measurement and verification steps. The published possession and shot totals here are not a substitute for a verified positional tracking dataset.
VAR, semi-automated offside and goal-line technology
The AFP/AP report states that Malen’s second goal was awarded after a VAR review, having initially been flagged offside. It also reports a later Mbappé goal being ruled out for offside. This makes offside review a match-specific part of the story rather than technology added merely because the competition is well known.
UEFA’s Refereeing guidance, dated 7 August 2026, says semi-automated offside technology is used in the Champions League from the play-off round onwards. It describes specialised cameras tracking body points to support the VAR team. That is competition-level evidence. The detailed system output and operational log for Malen’s review were not obtained, so this article does not invent an offside margin, review duration, ball-sensor reading or equipment configuration for that incident.
Goal-line technology addresses a different question: whether the whole ball has crossed the goal line. UEFA explains its camera-based GLT arrangements, but no match-specific goal-line alert or decisive GLT intervention was verified here. Nor should Malen’s offside review be described as a goal-line decision. IFAB’s VAR protocol also keeps the final decision with the referee; the technology is assistance, not an independent official.
Expected goals and advanced statistics
Expected goals estimates the probability associated with a shot under a provider’s model. ESPN displayed Roma 1.43 xG and Madrid 1.83 xG for this match. The figures add context to the opportunities recorded, but they do not replace the actual 3–4 score or guarantee that a repeat game would finish a certain way.
The provider’s displayed shot map gives a useful worked example: de Roon’s goal carried 0.05 xG, while Espí’s close-range rebound goal carried 0.86 xG. As a model interpretation, those values represent 5% and 86% estimated scoring probability respectively. Both shots became goals. One event can exceed a low expectation, and a high-probability opportunity still is not certainty. Our expected goals explained guide covers the calculation and model limitations in more detail.
ESPN’s breakdown also displayed Madrid’s set-play xG as 1.45 and open-play xG as 0.39. That gives a stronger analytical lead than possession alone: inspect the set-piece opportunities. Rounded components should not be forced to add perfectly to the displayed total, and provider values should not be silently mixed with another xG model.
Roma vs Real Madrid Key Player Performance Analysis
Player analysis should connect a recorded action with its context rather than assign a sweeping rating from one total. Malen’s two goals, Mbappé’s equaliser and the late Madrid scorers are verified events. Complete passing networks, individual running loads and automated defensive-space measurements were not available for this review.
Attacking performance
Malen’s two second-half finishes are the strongest documented Roma attacking contribution. ESPN’s match leaders listed four shots, three on target and 0.73 xG for him. Mbappé was listed with four shots, four on target and 0.15 xG. These provider figures show that a shot count, shot placement and pre-shot chance quality describe different things; four shots from different situations need not carry similar expected-goals values.

Espí and Endrick show why substitute analysis needs incident review. Espí’s goal followed a saved header and rebound in the AFP/AP account; Endrick then finished a corner with a header. Their contribution can be described through those specific sequences without claiming that an app predicted either goal or that their physical monitoring readings justified the substitutions.
Midfield performance
Mora’s introduction at half-time and his involvement in Malen’s first second-half goal offer a documented point for reviewing progression and reception positions. The right question is how the pass and run interacted. A single assist sequence does not establish a full passing network or a season-long judgement on a player.
A delivery before a goal can be an important contribution even when the passer does not take the finishing touch. A passing-network analysis would require the actual passer-to-receiver events and a clear period of play. Team pass accuracy is useful background, but it cannot identify which midfielders broke lines, retained possession under pressure or created the most valuable routes through the defence.
Defensive performance
Rüdiger’s winner is a scoring contribution by a defender, not a complete grade for his defending. A balanced review would also assess his defensive actions and positioning using individual event data and footage. ESPN’s team totals—Roma nine tackles and 14 interceptions, Madrid eight tackles and 13 interceptions—must not be attributed to him or another individual.

For Roma, the repeated late corner outcomes justify reviewing marking and rebound coverage. They do not prove that one defender was responsible for all three goals. A useful staff discussion reconstructs each task, checks the visible evidence and identifies a trainable detail. It avoids replacing tactical analysis with blame based on a broadcast close-up.
Match Statistics and Data Comparison
The table below uses the values displayed by ESPN for the completed match, checked on 15 October 2026. It is a single-provider snapshot, not a live feed. Definitions and rounding belong to that provider, so the values should be compared within this table rather than combined silently with another data service.
| Metric | Roma | Real Madrid |
|---|---|---|
| Goals | 3 | 4 |
| Possession | 54% | 46% |
| Total shots | 14 | 16 |
| Shots on target | 7 | 8 |
| Expected goals — xG | 1.43 | 1.83 |
| Pass accuracy | 86% | 84% |
| Accurate passes | 471 | 385 |
| Total passes | 546 | 459 |
| Corners | 5 | 9 |
| Fouls committed | 15 | 8 |
| Yellow cards | 3 | 1 |
| Red cards | 0 | 0 |
| Duels won | 34 | 47 |
| Tackles | 9 | 8 |
| Interceptions | 14 | 13 |
| Distance covered | Not verified | Not verified |
Roma’s passing totals are higher, while Madrid’s opportunity totals are higher. Neither observation erases the other. The combination suggests checking the locations and outcomes of attacking sequences rather than judging the match from one headline metric. Our sports analytics guide explains how to keep definitions and interpretation separate.
The final row is intentionally transparent. “Not verified” does not mean zero kilometres or that the clubs lacked tracking systems. It means no suitable public match-specific evidence was obtained to support a distance figure in this article.
How Technology Can Explain the Match Result
Technology explains the result best when it leads back to the decisive opportunities. Madrid’s higher displayed xG, greater shot count and nine corners support examining the volume and quality of attacking situations. The reported three late corner goals then identify the phase that changed the score. Together, these facts provide a defensible review path without pretending the statistics caused the goals.
The offside incident provides a separate form of explanation. Malen’s second goal helped Roma build a 3–1 lead, and the AFP/AP report states that VAR overturned the initial offside flag. That is a verified decision affecting the recorded score. It should not be mixed with the question of whether Madrid later created better set-piece chances.
Substitutions also belong in the timeline. Mora’s half-time introduction preceded his involvement in Malen’s goal, while Madrid’s late scorers included substitutes Espí and Endrick. Analysts can compare the events before and after changes, but the match result alone cannot isolate a substitution’s effect from the opponents’ response, delivery quality and other changes in play.
The most tempting unsupported explanation is fatigue: a team concedes late, so the dashboard is said to show tired players. No such dashboard was available here. To assess that claim, a coach would need contextual workload information, player reports and a verified tracking feed. Until then, the evidence supports a set-piece review—not a diagnosis of why each player moved as they did.
What Coaches and Analysts Can Learn From Roma vs Real Madrid
Start with a small, answerable question. For a team reviewing this game, “How did we handle the first and second phases of corners?” is more useful than “Why did we lose?” Tag the restart, initial contact, rebound and final shot as related events. Include successful clearances as well as goals so the review does not select only the most dramatic outcomes.
Use numbers to choose clips, not to replace them. A set-play xG breakdown can highlight opportunities worth examining; a replay can explain the delivery, contact and space around the finisher. Keep model estimates, event labels and the coach’s interpretation in separate fields. That makes it easier to correct a tagging mistake without rewriting the match history.
Verify identity and visibility before measuring space. If a camera loses a runner behind the group at a corner, record that uncertainty rather than filling the gap with a guessed path. A short television replay may be enough to see the touch but not enough to evaluate the entire defensive shape. The confidence of the conclusion should match the coverage of the footage.
Finally, convert a supported observation into an exercise rather than a technology promise. A coach might rehearse rebound responsibilities, runner communication or the transition after a clearance. This is an application of the review framework, not a report that either club conducted that exercise or that software guaranteed its success.
Final Verdict: Roma vs Real Madrid Match Analysis
The strongest supported explanation is Madrid’s late set-piece production, not possession dominance or a supposed private AI instruction. Roma led 3–1, but the reported corner sequences at 83, 85 and 90 minutes changed the match. ESPN’s 16–14 shots, 9–5 corners and 1.83–1.43 xG comparison give those incidents useful statistical context.
The match also illustrates two distinct roles for technology. Officiating assistance contributed to a reported offside review, while video and statistical analysis help readers understand the opportunities and defensive questions after the event. GPS workload data and detailed positional tracking could add another layer, but they should not be invented when unavailable. For the wider relationship between measurement and coaching, continue with our wearable technology in sports guide.
Frequently Asked Questions
How can sports technology improve Roma vs Real Madrid match analysis?
It can help organise clips, compare recorded events and assess measured player positions where validated tracking is available. For this match, published statistics and a reported VAR intervention are verified; private club GPS feeds and coaching software were not obtained.
Which statistics are most useful for understanding this match?
The shot, corner and xG comparisons are useful alongside the goal timeline. ESPN displayed Madrid ahead 16–14 in shots, 9–5 in corners and 1.83–1.43 in xG. Those figures help direct a set-piece review; they do not make possession irrelevant or establish one player’s responsibility.
How is AI used in football match analysis?
AI can suggest event tags, group clips and support player tracking, depending on the system and footage. A human should verify the events, identities and context before using an output. No specific private AI platform used by Roma or Madrid was verified for this article.
How do GPS trackers measure football player performance?
GPS systems estimate movement from positioning data and may combine it with inertial sensors. Distance, speed and high-intensity totals depend on measurement quality and definitions. This article has no verified GPS figures for the match and does not estimate them from the final score.
How do xG statistics help explain a football match?
xG adds a model-based view of shot quality. Here, ESPN’s displayed totals provide context for the opportunities, while the actual outcome remains Roma 3–4 Madrid. Values from different providers should not be treated as interchangeable, and high xG never guarantees a goal.
How do VAR and goal-line technology differ?
VAR supports eligible match decisions using video and communication with the referee. Goal-line technology addresses whether the whole ball crossed the goal line. Malen’s reported offside review was a VAR-related incident; no decisive goal-line alert was verified in this game.
Page metadata and photo credits
SEO title: Roma vs Real Madrid: Match Analysis Using Sports Technology. Meta description: Roma vs Real Madrid finished 3–4. Explore verified tactics, lineups, xG, corners and the VAR review, with clear limits on GPS and AI claims. Primary keyword: Roma vs Real Madrid. Supporting terms: football match analysis, sports technology in football, AI football analytics, player tracking technology and expected goals in football. These describe this page; they are not certified search-volume figures or a guarantee of rankings.
The title and description are also implemented in the page head. This visible notes section is kept after the article, not as a top keyword list. The canonical page uses SportyTechs’ established article structure: /article/roma-vs-real-madrid-match-analysis. There is one article owner, not a second competing root page.
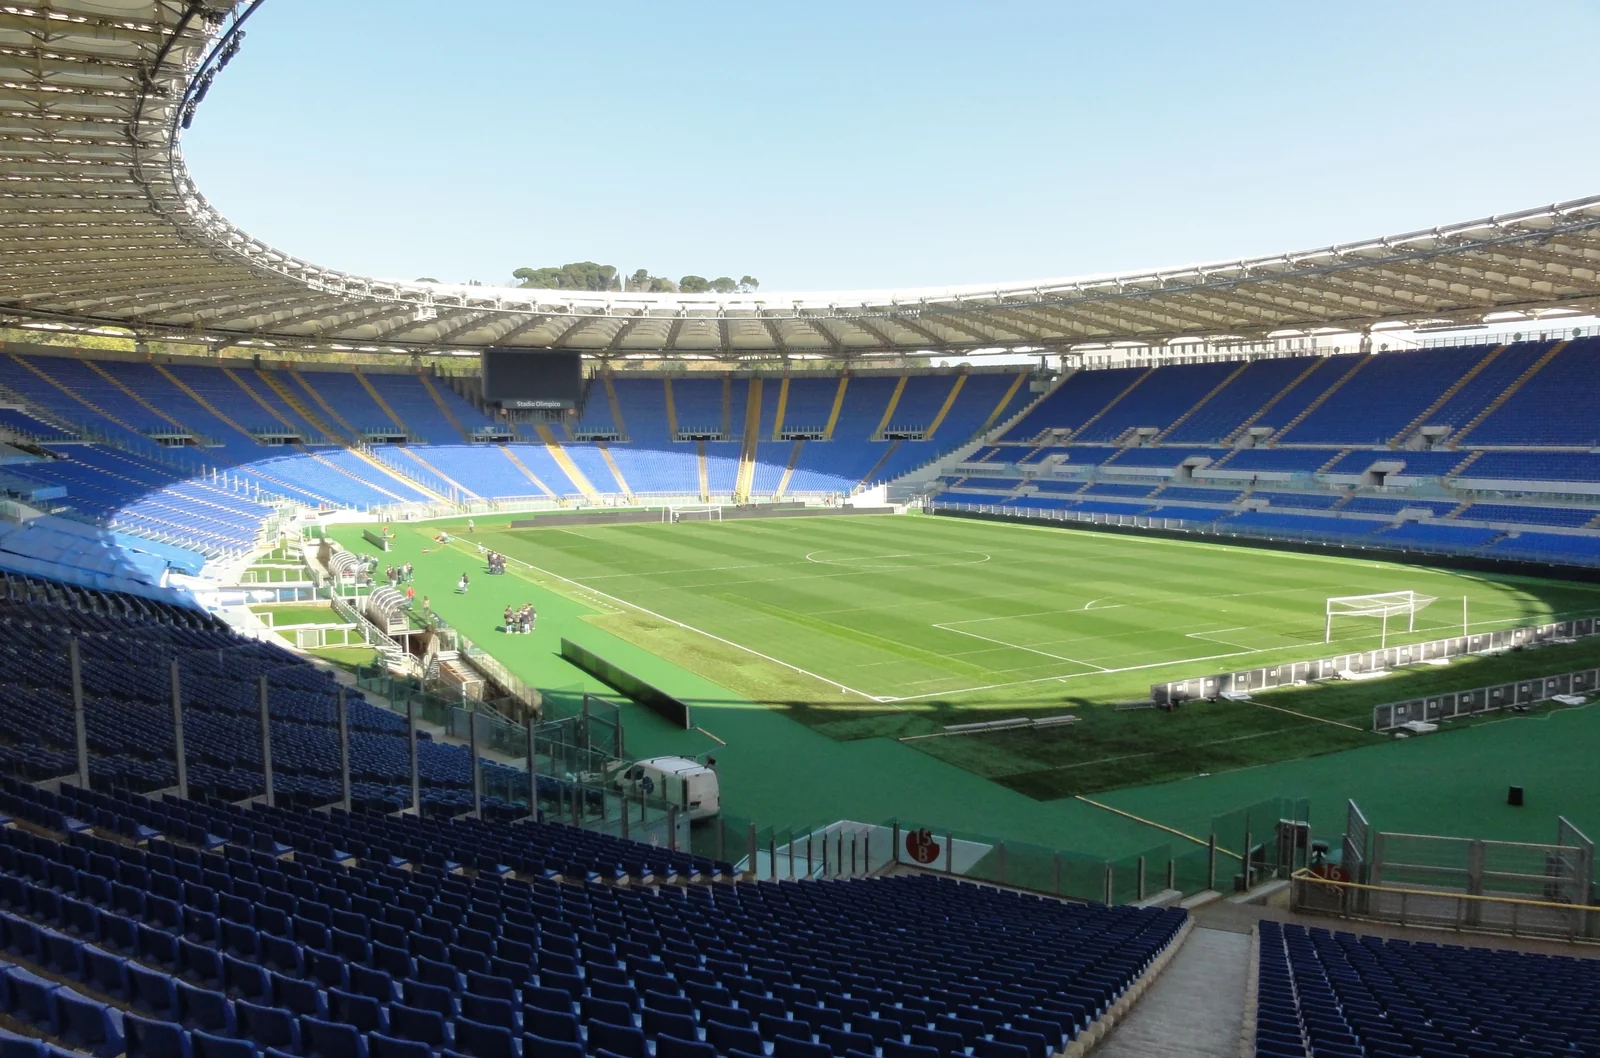
Cover: Stadio Olimpico photograph taken 12 March 2014, © ildirettore, Wikimedia Commons File:Stadio Olimpico (Roma, ITA).jpg, CC BY 3.0. The source was cropped by Leonprimer in 2022; SportyTechs resized and converted it to WebP without a new crop. It is venue context, not match-day coverage. The complete CC BY 3.0 license accompanies the photograph.
Malen photograph: © Steffen Prößdorf, 6 November 2021, Wikimedia Commons File:Donyell Malen 2021.jpg; previously cropped, resized and converted to WebP here. The complete CC BY-SA 4.0 license applies to the adapted photograph. The source carries a DFL editorial-use notice: this use identifies a player in editorial analysis, not an advertisement, product endorsement or image sequence.
Rüdiger photograph: jeollo / vfb-exklusiv.de, Wikimedia Commons File:Antonio ruediger.jpg; archival VfB Stuttgart training image uploaded 16 January 2012, capture date unspecified. Converted to WebP without a new crop. The complete CC BY-SA 3.0 license applies to the adapted photograph. The complete photo credit and source record retains the source identifiers, creator credits and source URIs. No photographer, player, club or licensor endorses this article.
Source notes: score, lineups, goal timing and numeric tables use ESPN’s Roma–Real Madrid match and team-statistics pages; event descriptions are corroborated by the AFP/AP report published by Al Jazeera on 14 October 2026. UEFA’s Refereeing guidance of 7 August 2026 supports competition-level technology explanations, and IFAB’s VAR protocol supports the distinction between video assistance and referee authority. All were checked on 15 October 2026. This is a sourced editorial analysis, not a first-hand tactical-camera audit, licensed broadcast reproduction or account of private club tools.