Sports science connects questions, measures and decisions
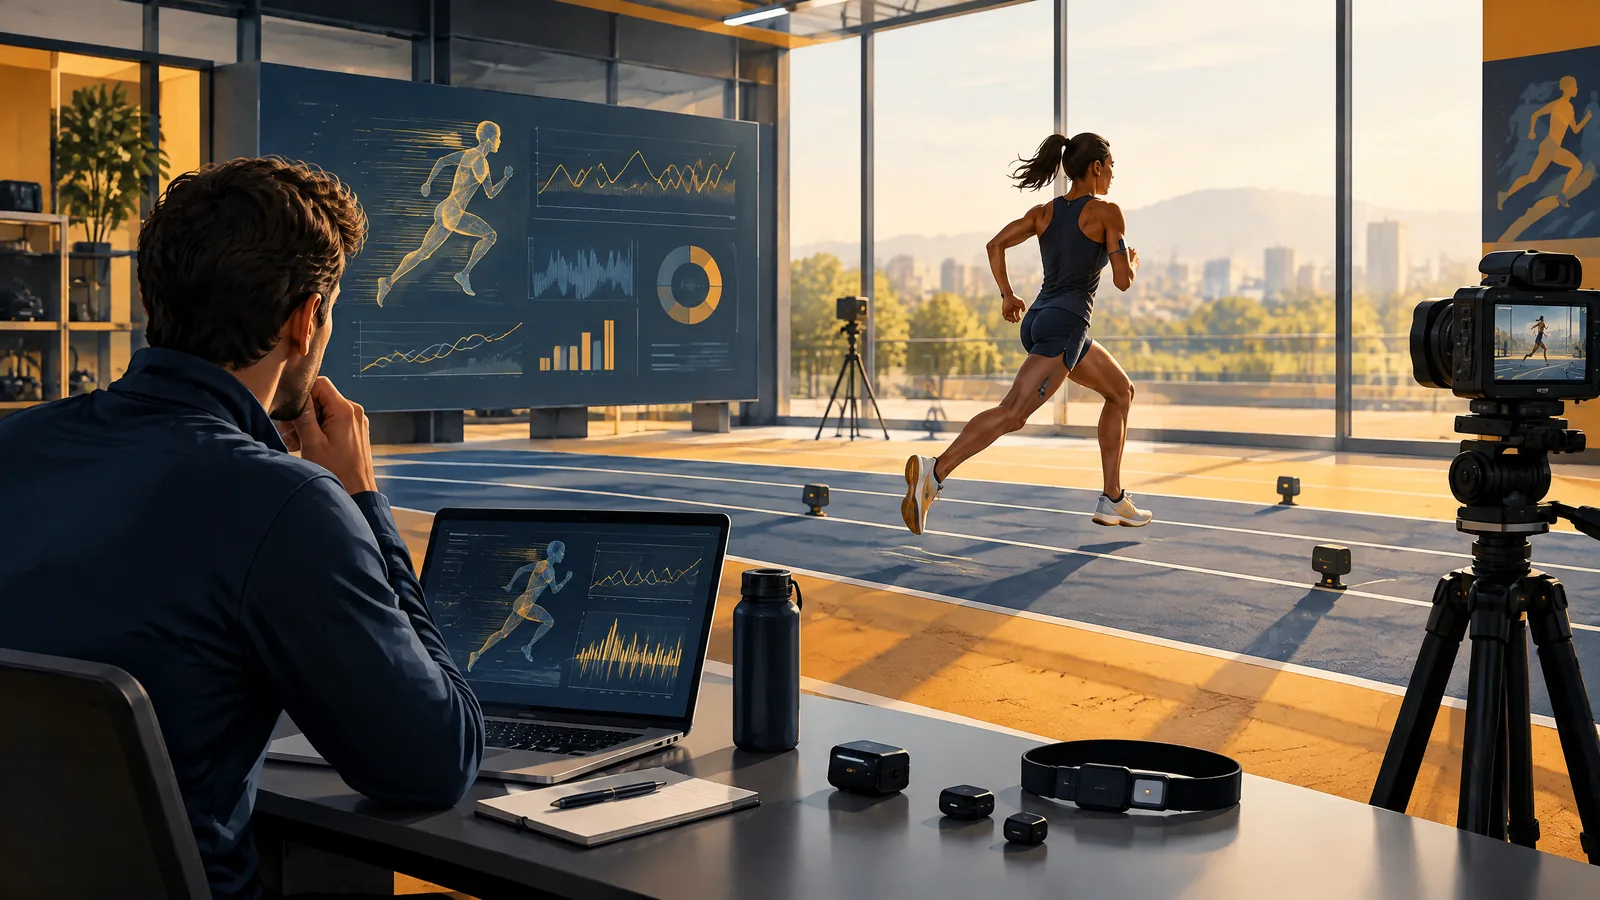
Sports science and training technology are not a single dashboard or wearable. They are a way to turn a practical question—such as whether today’s session matched its intended demand—into observations, careful interpretation and a human decision. Cameras, timing tools, athlete performance tracking and a sports telemetry system can contribute evidence. None makes the decision automatically.
This hub explains the workflow, then points to specialist guides. It is not a device review, a diagnosis or a personalised programme. A useful system should help a coach, athlete or student state what was observed, how it was calculated and what remains unknown.
Start with a decision, not a device
Choose the question before collecting a metric. “Did the team complete the planned running exposure?” is clearer than “What data do we have?” It identifies a session, a planned reference and an observable result. A different question—how a movement was performed—may need video or a motion method rather than distance.
That order matters because the same sports performance tech can produce many numbers. A high value is not automatically good, bad or comparable with another person. FIFA’s EPTS programme, for example, separates equipment safety testing from tests of positional and velocity accuracy. A device being acceptable to wear is not, by itself, evidence that every output answers a coaching question.
The data path has four connected layers
First, a system captures an observation: position, time, movement, a self-reported response or video. Second, software turns signals into a defined measure. Third, people compare that measure with a relevant baseline and session context. Finally, they record what they decided and review whether the process helped. Losing any layer creates false certainty.
For example, a location trace can become total distance, but software settings decide how noise and brief changes in speed are handled. A label such as “load” may be calculated differently by different providers. Keep one definition and one collection routine when comparing a sequence of sessions. If the system, thresholds or context change, label the break rather than treating the chart as one continuous series.
What common streams can—and cannot—show
Sports wearable technology can capture movement or physiological signals; cameras can locate people or objects; timing tools record an interval; and athlete notes can add sleep, travel or perceived effort context. Each gives a partial view. An inertial sensor measures acceleration at its location, while an optical system derives movement from camera observations. Neither directly reads motivation, technique quality or future performance.
Use the detailed guide to wearable technology in sports for sensor categories, validation and data rights. For the mechanics and trade-offs of camera and inertial approaches, see motion capture in sports. Those specialist pages should carry the device-level detail; this hub’s job is to keep the question, method and decision connected.
Make a trend comparable before interpreting it
A useful comparison has a stable unit, repeatable method and relevant context. Note whether a session was indoors or outdoors, the sport format, surface, playing position, duration, equipment and software settings. A figure can change because the athlete’s activity changed, but it can also change because the measure or conditions changed.
Think in ranges and questions, not a single pass/fail cut-off. A repeated pattern may prompt a conversation, a check of the raw record or a look at the training plan. It does not establish a cause. Sports biomechanics analysis can help describe movement variables, but it is a separate method and interpretation task; sports biomechanics analysis covers that focused subject.
A hypothetical session calculation
Hypothetical example: a coach records 4,800 metres for a 60-minute practice. Dividing distance by time gives 80 metres per minute. That is a description of this recorded session, not a fitness score. If another practice records 5,400 metres in 75 minutes, its average is 72 metres per minute. The second session has more total distance but a lower average rate.
Before concluding that one was harder, the coach would check the sport activity, rest intervals, position, measurement method and intended objective. Strength work has different observations again, such as movement speed under a stated load; strength and conditioning analytics explains that specialist area. The arithmetic is simple. Making it meaningful requires context.
Keep people, permissions and review in the loop
Digital sports training works best when participants know what is collected, why it is collected, who can access it and how long it is kept. NCAA responsible-use guidance emphasises selection quality, informed participation, data management and feedback from people using the technology. A shared, simple explanation often improves the quality of the notes around a number.
A practical review asks: Did this measure answer the original question? Was collection workable? Did people understand the output? Did the decision need more context? Change or retire a metric that does not earn its place. AI can help organise or suggest questions around a plan, but it should not become an unquestioned coach; read AI-generated athlete training plans for that workflow and its limits.
Sources
FIFA, *Electronic Performance and Tracking Systems (EPTS)*; FIFA, *EPTS Testing Process*; NCAA, *Performance Technologies Recommendations: Responsible Use in Collegiate Athletics* (March 2026); and Torres-Ronda, Beanland, Whitehead, Sweeting and Clubb, *Tracking Systems in Team Sports: A Narrative Review of Applications of the Data and Sport Specific Analysis* (2022).